|
| |||||||||||
MeetingQuality Organizational Outcome Family: Strategy Team Meeting Use Case |
|||||||||||
Use Case: How MeetingQuality is deployed within a Strategy Team |
|||||||||||
This page illustrates the steps a Strategy Team would follow from issuing meeting invitations, to receiving and submitting the assessments, to receiving and utilizing the metrics and reports. |
|||||||||||
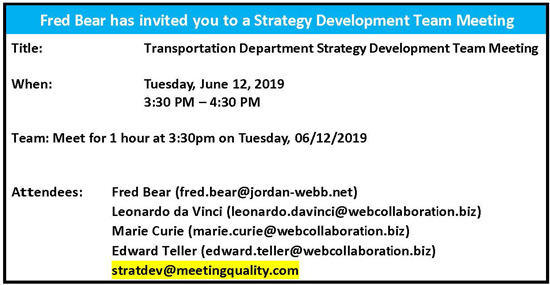
1. Strategy Team adds one additional email address to team’s meeting invitation (stratdev@meetingquality.com) |
2. As meeting begins, team members receive an email
|
||||||||||
 |
 |
||||||||||
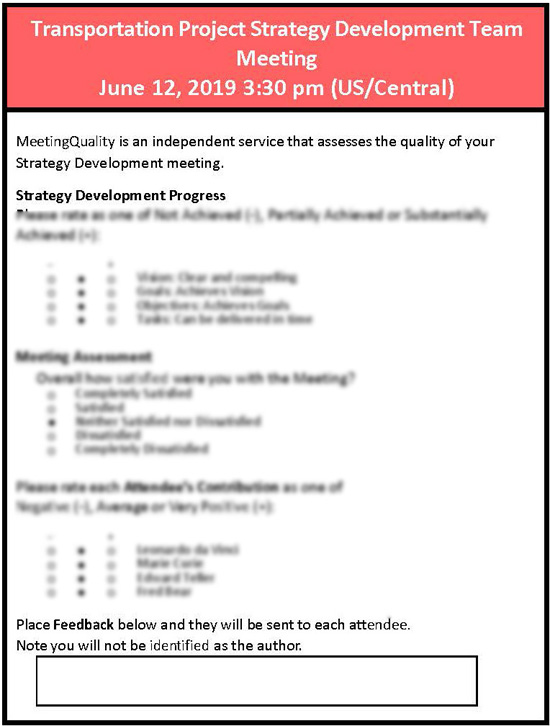
3. When meeting ends, attendees complete their meeting assessments (taking 45 seconds or less) |
4. MeetingQuality’s secure server aggregates the results using proprietary and Social Network Analysis algorithms and applies Artificial Intelligence (IBM Watson) to the action items |
||||||||||
 |
 |
||||||||||
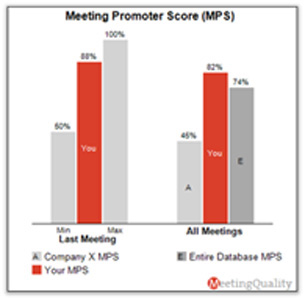
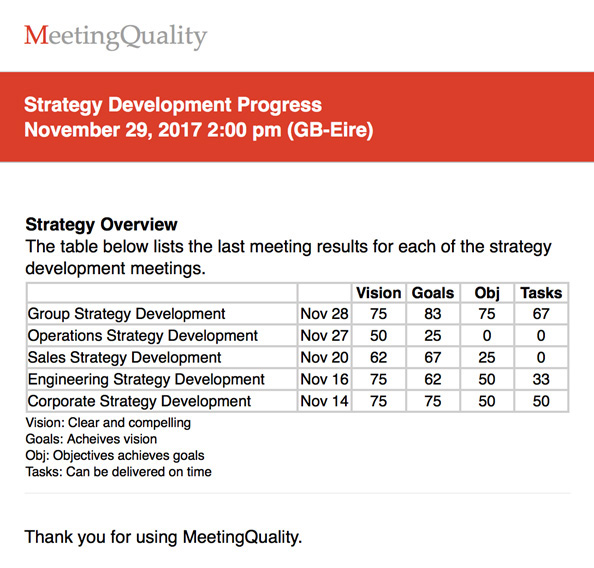
5. 24 hours after meeting ends, Strategy Team members are emailed these metrics / reports… |
|||||||||||
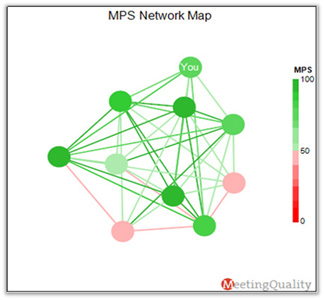
Meeting Promotor Score (MPS) (peer-rated quality of contribution) |
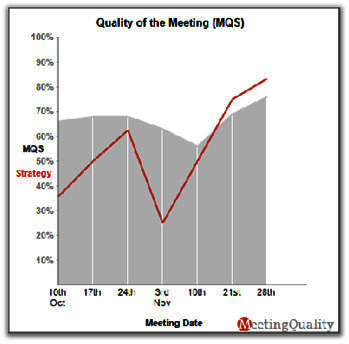
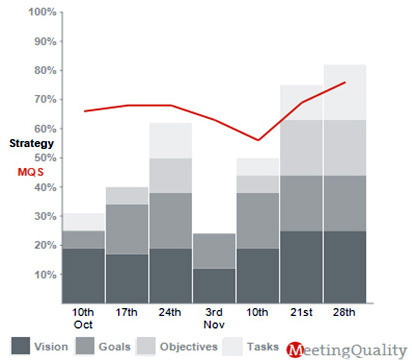
Meeting Quality Score (MQS) [red line] versus progress towards Strategy over time |
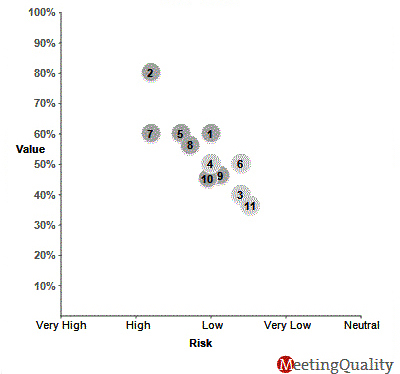
Action Items / Feedback (reported anonymously) (author name un-traceable) |
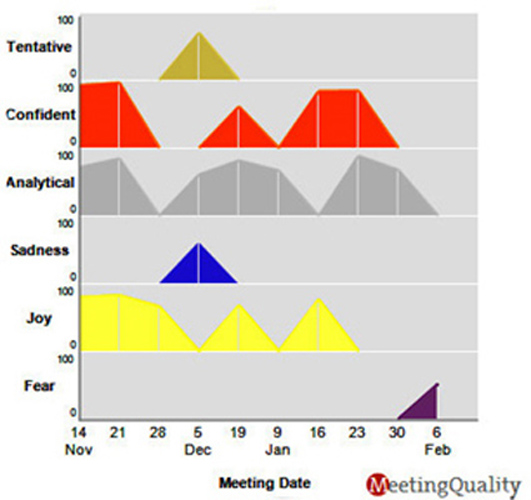
Analysis of Action Items over time using Artificial Intelligence (IBM Watson) |
||||||||
 |
 |
|
 |
||||||||
 |
6. Strategy Team incorporates the discussion & review of metrics and reports into ongoing project status meetings as part of the strategy planning methodology used. MeetingQuality Consulting Partners provide management advisory services by interpreting the results and turning them into real-world solutions… |
||||||||||
7. Periodically, Strategy Team members are emailed other metrics / reports – such as… |
|||||||||||
|
|
|
|
||||||||
|
|
||||||||||
 |
 |
 |
|
 |
|||||||